sehyeonjin.com

The Underdog Uprising in the Premier League

Data Analytics

Project Overview

Finding the most cost-effective Forward for the Underdog Clubs

Money determines everything in the modern soccer game. Recently, It is getting hard to compete in the Premier League for lower-ranked teams having less money than other huge clubs such as Manchester City.

Project

Team Project

My Role

Data Scientist

Duration

3 weeks

Tools

Tableau, KNIME, Excel

Objective

How might we find strikers who can achieve the best efficiency at a low cost by utilizing stat data such as xG?

Solution

The correlation among the variables were found and all classified data of forwards were grouped into three categories using several methods in order to find a pattern make a predictive model.

Project Process

Discover

Understanding The Problem

With some clubs with a lot of money participating in the Premier League gaining ground, the others are gradually narrowing their positions. It is even getting more impossible for middle and lower-ranked teams to sign talented and famous players amid fierce competition that cannot survive if they have less money than the richest clubs in the league.

Comparison of transfer fee expenditures by Premier League club in the 20-21 season (unit: Million Euros)

According to Transfermarkt.com, we compared transfer fee expenditures by Premier League clubs in the 20-21 season and it was shown that the league average of 76.4 million euros and the league median of 68.8 million euros, whereas Chelsea and Manchester City which are owned by Russian and Arab multi-billionaires spent 224.7 times 151.6 times higher each. These clubs are willing to pay high transfer fees, so that there’s no choice but to show high transfer fees eventually become an indicator of players' skills. In other words, the polarization of finances between the the top-ranked and the lower-ranked clubs is getting worse and it may not be possible to prevent the outflow of fans from the lower clubs. In this situation, our goal is to select strikers who can achieve the best efficiency at a low cost by utilizing stats such as xG for the rebellion of lower-ranked teams, which we called ‘the Underdogs’, in the Premier League.

Define

Hypothesis

  • There might be a correlation between classic and alternative stats such as xG.
  • The players we’re looking for might higher the probability of scoring.

Solutions

  • Using Linear Correlation, Random Forest, Decision Tree analysis to classify and predict the high correlated variables
  • k-Means Clustering to classify players into three groups and predict the best players

Collecting Data

From the 2014-15 season to the 2019-2020 season at Kaggle, the stats of each player in La Liga, the Premier League, and other major European leagues were collected to create a new dataset. The dataset, In-depth soccer statistics: xG, xA and more, released by one Kaggle user, was collected on understat.com, the only website that discloses indicators such as xG and xA to the public.

Independent Variables

Dependent Variables

Analyze

Linear Correlation

In order to find out what correlation there is between variables, correlation analysis was first conducted for each year. Since the target dependent variable was clearly defined as goals and assists, the correlation with those variables was particularly focused. At this time, if the correlation coefficient with the corresponding variable is less than 0.5, it will not be considered in the next analysis.

As a result, in the 2014-15 season, independent variables showing correlation coefficients of 0.5 or more for goals and assists were npg, xG, npxG90, shots, xGChain, xA, xA90, key_passes, and xGBildup. The same result was shown until the 2019-2020 season.

Random Forest(Regression)

Since our biggest goal was to find a group of strikers with good value, the team focused on classifying and predicting players after completing the correlation analysis. So it was focused on finding variables with high explanatory power, which means, high R^2 scores, in relation to goal prediction using Random Forest(Regression). Starting from the 2014-15 season to the 2019-2020 season, after defender and goalkeeper position were excluded, data for each season were analyzed by using the regression method. We did Z-score Normalization for all variables prior to the analysis.

R^2 result of npxG in 2014-15 season

R^2 result of xG in 2014-15 season

For the goal prediction, as a result of the R^2 scores of all variables in the 2014-15 season, R^2 of xG was 0.805 and the highest among the variables. The value of npxG was 0.774.

R^2 result of key_passes in 2014-15 season

R^2 result of xGChain in 2014-15 season

Next, R^2 of xGChain was 0.292, key_passes and variables such as shots, xGBbuildup, and yellow card’s R^2 value were negative. These results were derived from the 2014-15 season to the 2019-2020 season. Therefore, as a result of Random Forest (Regression), it was inferred that the xG related variables, xGChain, xG, npxG had the highest explanatory power in the goal prediction.

Decision Tree

Decision Tree was to find meaningful variables through the model and check whether pre-processed players were classified well. Also, the method was used for results derived from the previous season's dataset in order to see how the player data of the next season was well-classified. In other words, through the Decision Tree model of the previous season, we wanted to know how players would be classified next season. First, to find meaningful variables and validate our model, we used the Decision Tree model with a dataset of six seasons. In order to utilize the model, some groups must be designated in advance for each data previously. Therefore, it was decided to use the sum of the initially set dependent variables, the Goal variable and the Assist variable. A new variable was created by dividing the sum of goals and assists by the time they played, and through this result, each group of players was divided into A (top 25% group), B (top 50% group), C (bottom 50% group), and D (bottom 25% group). The reason for dividing the time spent playing is to normalize the result value, and in particular, there are many cases where the sum of goals and assists overlaps with each player, causing problems in group designation. In addition, Players under 150 minutes were removed through Filter. Through the above process, the following results were derived.

Statistic Results of the decision tree analysis

Decision Tree Views

The results were derived with an Accuracy of 67.14%. The results of each of the six years also showed similar results. It was confirmed that the accuracy was quite low because few data were overlapped between the groups. Also, the results were too complicated, it was necessary to remove all unnecessary variables, so that ROC curve was used.

ROC Curve from 2014-15 to 2019-20 season

ROC Curve in 2014-15 season

In the case of the ROC curve, the wider the AUC area, the better the model performance. In other words, the more outward the line is, the better the variable is. From the above results, it was found that npXg90, xG90, npxG, npg, xA90 are necessary. On the other hand, teams_played_for, xGBbuildup, yellow cards, minutes played, and red cards were considered as variables to be removed because the values were relatively low. Therefore, the above variables were removed and we did the Decision Tree analysis again.

Our goal was to target players who were classified as low groups in the previous season's data but moved more than one level next season. In other words, Group A players were excluded because they would be expensive, and mainly looked for players who were moved from group B to group A, group C to group B or group C to group A. Meanwhile, it was extremely rare for D group players moved to B or A.Our goal was to target players who were classified as low groups in the previous season's data but moved more than one level next season. In other words, Group A players were excluded because they would be expensive, and mainly looked for players who were moved from group B to group A, group C to group B or group C to group A. Meanwhile, it was extremely rare for D group players moved to B or A.

Results

Since the Decision Tree was derived through two seasons, it can be seen that the accuracy is lower than that of the previous model. Again, as in the previous results, it could be seen that there was no clear distinction between the B and C groups. Nevertheless, based on the accuracy of nearly 70%, we looked for some players whose groups were changed to the uppers.

We highlighted some players who were moved into the upper groups. Players who had missing values in Prediction referred to retired or transferred to the other league. The above results were a comparison of the 15-16 and 16-17 seasons, so that this results shows whether he performed well in the 17-18 season. Juanmi, who played for Southhampton, moved to Real Sociedad in La Liga, Spain, next season and performed well. However, in the case of Jay Rodriguez, who was in the same team, he lost a season due to injury next season. As you can see, some unlucky cases such as injuries could happen through the model. Meanwhile, since the most recent dataset also exists, results were also derived from the most recent season values. The 18-19 season was used as data for the previous season, and the 19-20 season data was used as data for the next season, so it was possible to check whether the highlighted player actually performed well in the next season. The model could also be evaluated through this. The players were compared with the following k-Means clustering results.

k-Means Clustering

As there was a concern that the accuracy of the result only with one model was somewhat degraded and the performance of the Decision Tree itself was not evaluated as excellent, we tried to verify our model through k-Means clustering method. k-Means Clustering was used to produce results similar to the Decision Tree. Since necessary variables have already been sufficiently selected, the purpose wasn’t to find such variables. However, it was important to find players who moved to the groups through data from the previous season and the next season. Before the analys began, we found an ankle point of the k.

k ankle point

Row0 was started with 2. The ankle point was k=3. However, since the pre-set quantiles were divided into four quantiles, A, B, C, and D, we limited group changed cases from group B to Cluster0 and group C to Cluster1.

Scatter Matrix

The difference between Cluster_0 (blue in the table above) and other clusters was clear, but the difference between Cluster_1 and Cluster_2 was not very clear. However, since our target group was Cluster_0, we compared it with the existing quartile group. The comparison results were as follows.

As mentioned above, the purpose was to find players classified as Cluster_0 in existing B or C groups. Finally, we found three players who had a meaningful result value through k-Means Clustering and the decision tree analysis.

k-Means Clustering

Decision Tree

The following three players were found and checked to see if they actually performed well in the 20-21 season. Through some research, it was found that they actually showed a meaningful performance in the next season.

Implementation

The following players are three players from the k-Means clustering and the Decision Tree results. In the case of these players, overall, they actually showed significant performances. Players such as Sebastian Haller and Nathan Redmond, who had a high score either in the k-Means clustering or Decision Tree, have performed well in the 20-21 season and this season.

Diogo Jota

Portuguese 25-year-old striker Diogu Jota currently plays for Liverpool in the Premier League. He moved from Wolverhampton to Liverpool for 45 million pounds in 2020 and scored nine goals in 19 games in the last 20-21 season. Also, in 16 games in the ongoing EPL 21-22 season with nine goals and one assist, he is currently the second top scorer in the Premier League, showing better performance as the years go by. Since xG is 8,53 lately, it could be inferred that he does better performance this season. Therefore, he is a very good high-scoring player, so that he is the ideal player we are looking for.

Market Value of Diogo Jota

As you see, the expected transfer fee(market value) is on an upward curve, and if the transfer is made in the future, the transfer is expected to be made for well over the existing transfer fee, 45 million pounds.

Ismaila Sarr

Senegal striker Ismaila Sarr, born in 1998, transferred from top league of france to Watford for 30 million pounds in 2019 and has been playing in the Premier League for two seasons. He scored five goals in 28 games in the 19-20 season and scored 13 goals in 39 games in the 20-21 season, when his team was relegated to the second league, the Championship League. As of the 21-22 season, which was promoted back into the Premier League, he has scored 5 goals in 12 games. Also, considering that xG is 3.51, he shows better performance than xG value. He’s a player who has the strength of dribbling and goal determination. He’s in good physical condition and still young so that he is likely to perform well in the future. 

Market Value of Ismaila Sarr

Although the team is currently ranked 17th place, so there is a possibility that it will perform better when it is transferred to another team in the future because he is still competitive in the league. As he plays well this season, the market value is expected to rise, so he is expected to transfer for more than 30 million pounds.

David McGoldrick

Irish striker David McGoldrick is a 34-year-old player of Sheffield United who transferred from Ipswich to Sheffield United for 10 million pounds in 2018, scored 15 goals in 45 games in the 2018-19 second division championship, scoring 2 goals and 2 assists in 28 games in 19-20 and 8 goals and 4 assists in 35 games in 20-21 seasons. His team was relegated to the Championship again in the 20-21 season and currently has two goals in 13 matches. He is a player with strengths in mid to long-range shots and heading. However, because the average professional soccer player peaks between the ages of 25 and 27, it is inferred that his physical capabilities tend to begin declining.

Market Value of David McGoldrick

Therefore, the current expected market value is a little higher than the transfer fee in 2018, and the market value hasn’t increased significantly over time. Considering that he is a 34-year-old striker, it is likely that the aging curve is currently underway, so it is going to be difficult for the lower-ranked club in the Premier League to sign him.

Conclusion

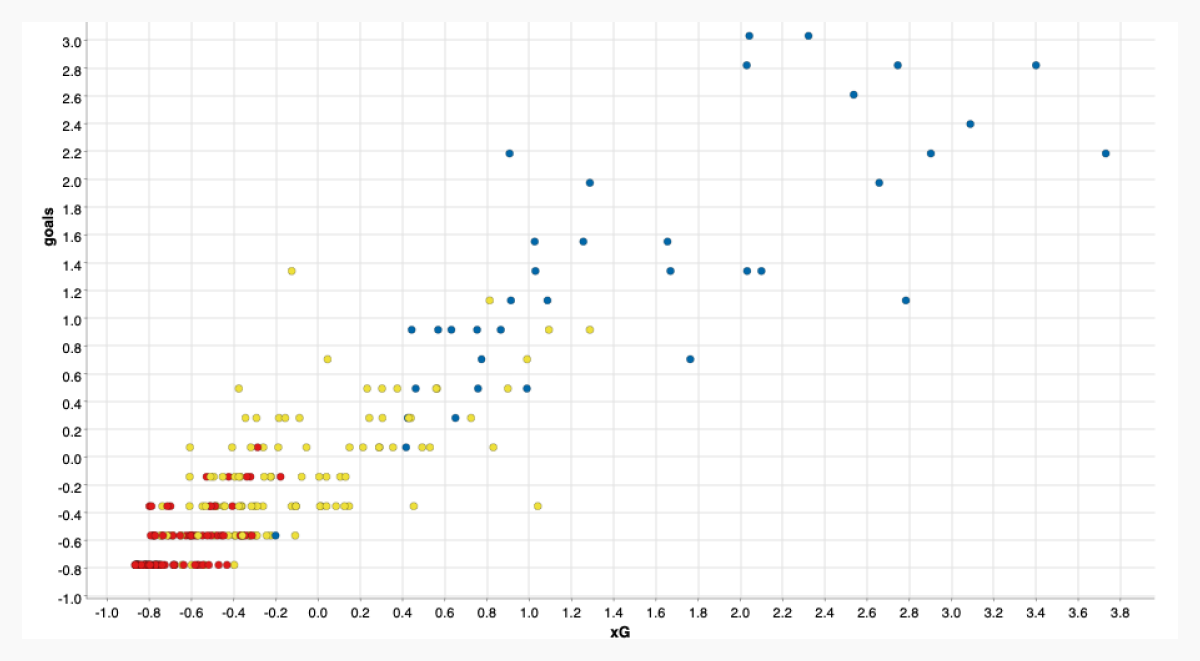
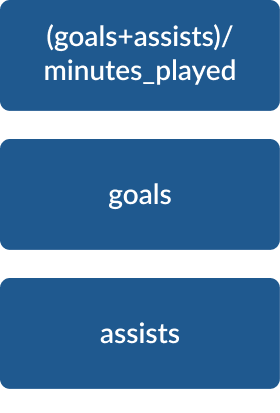
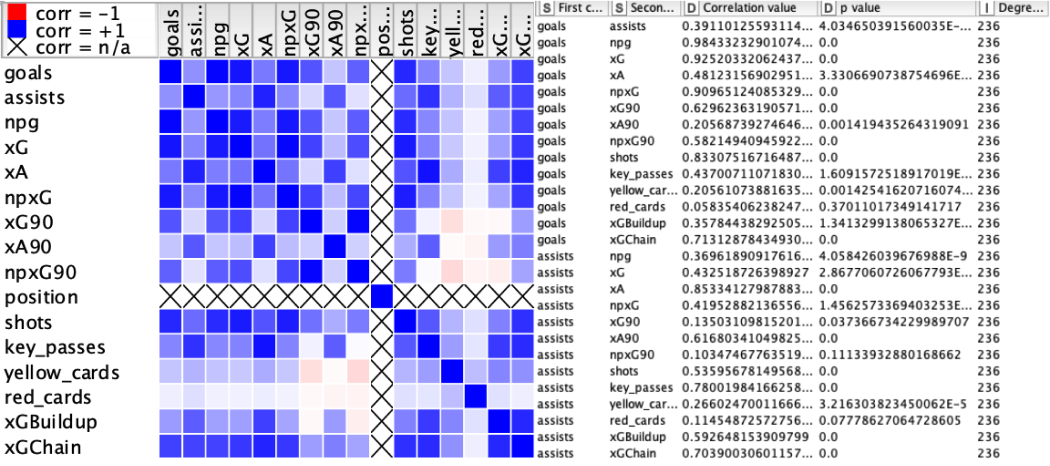
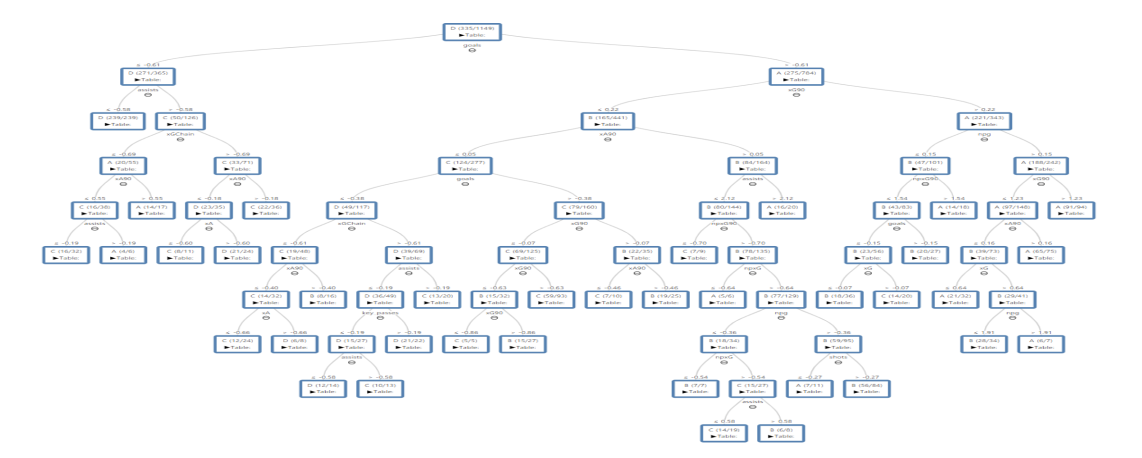
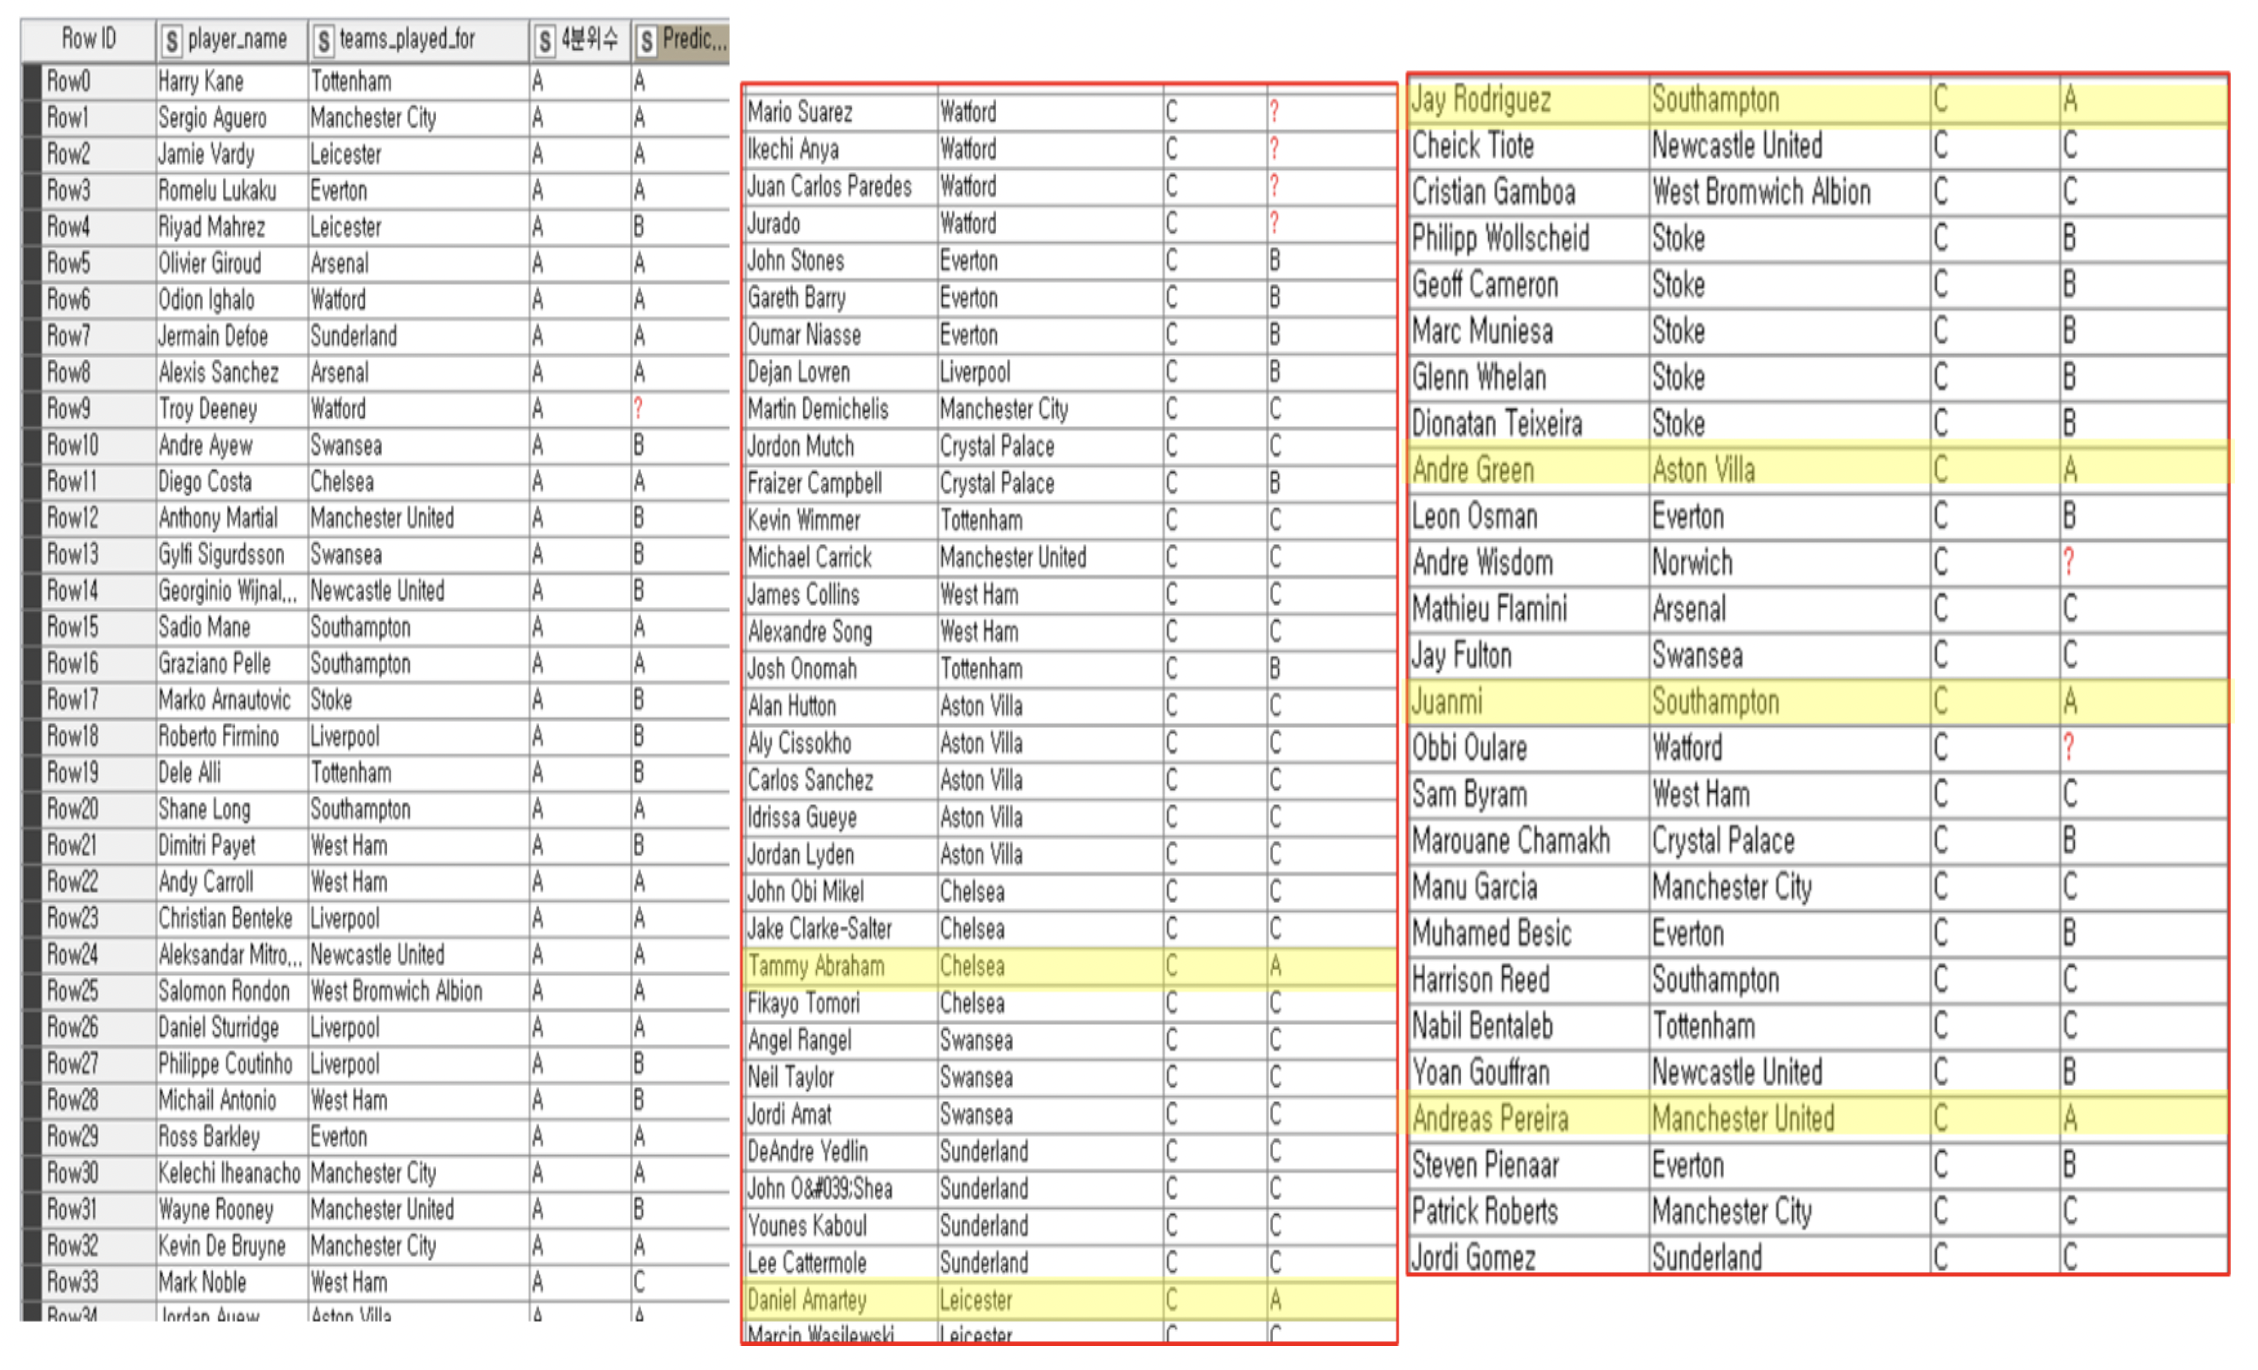
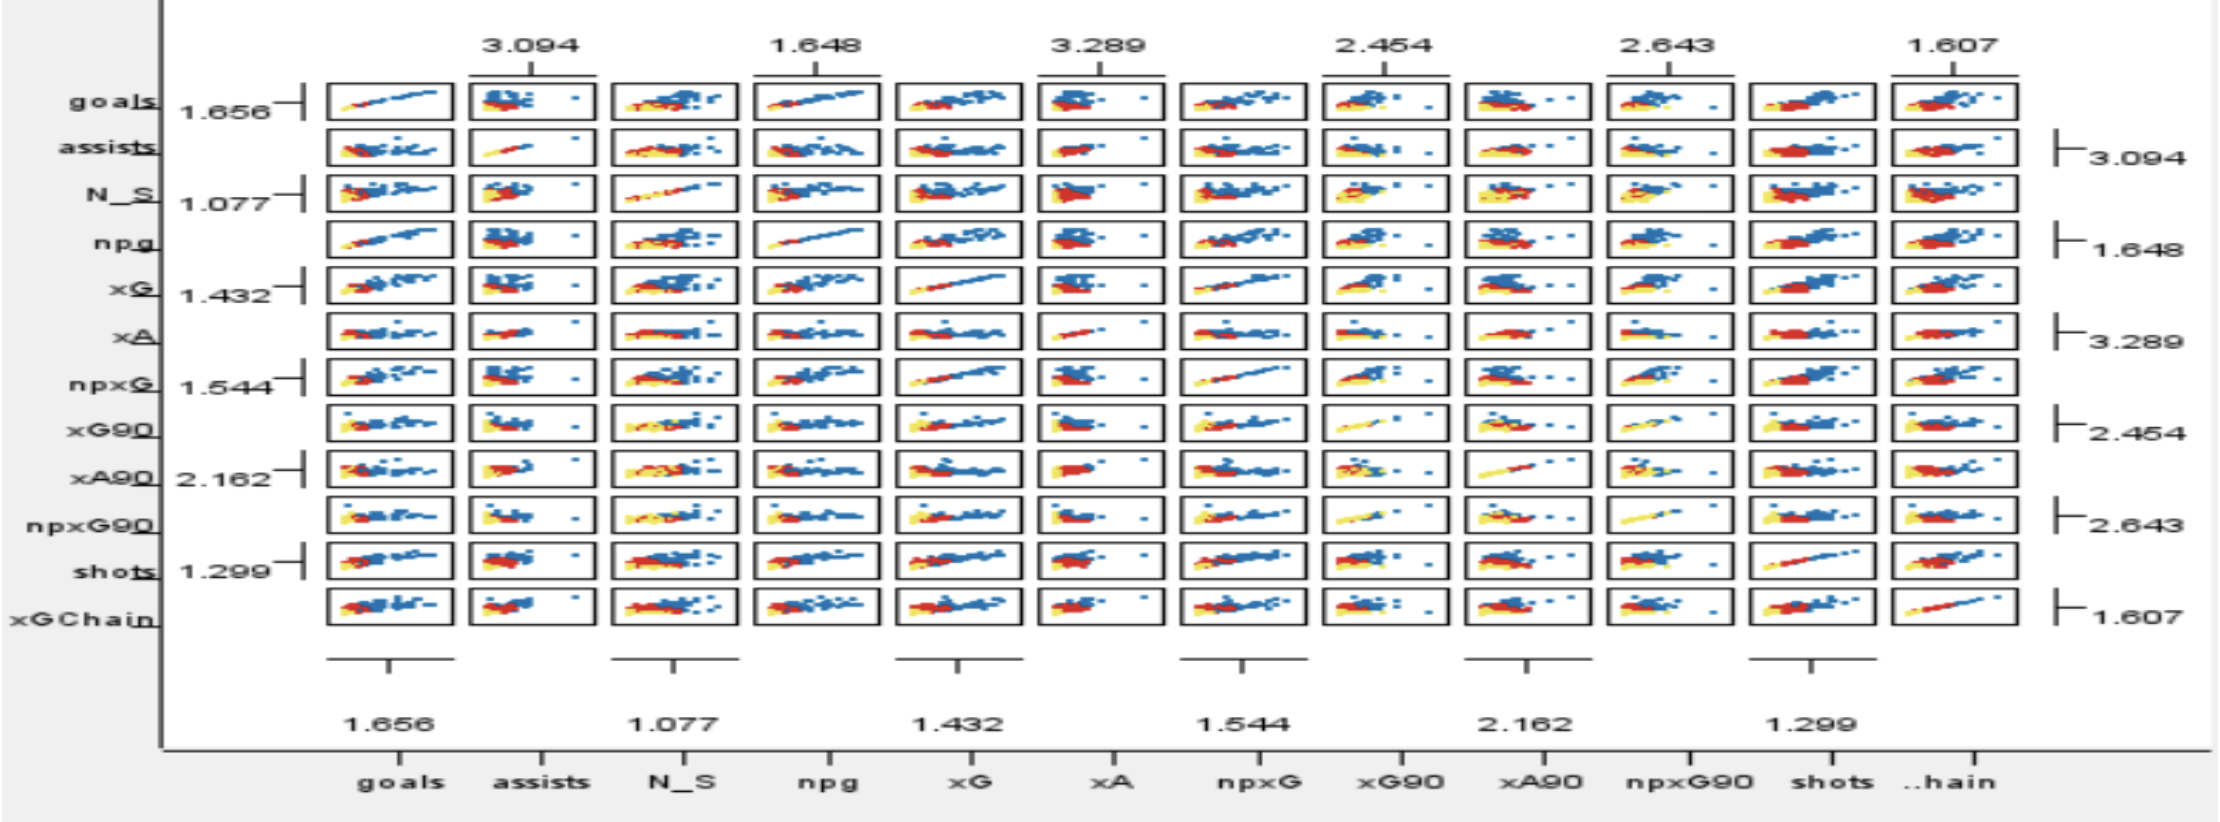
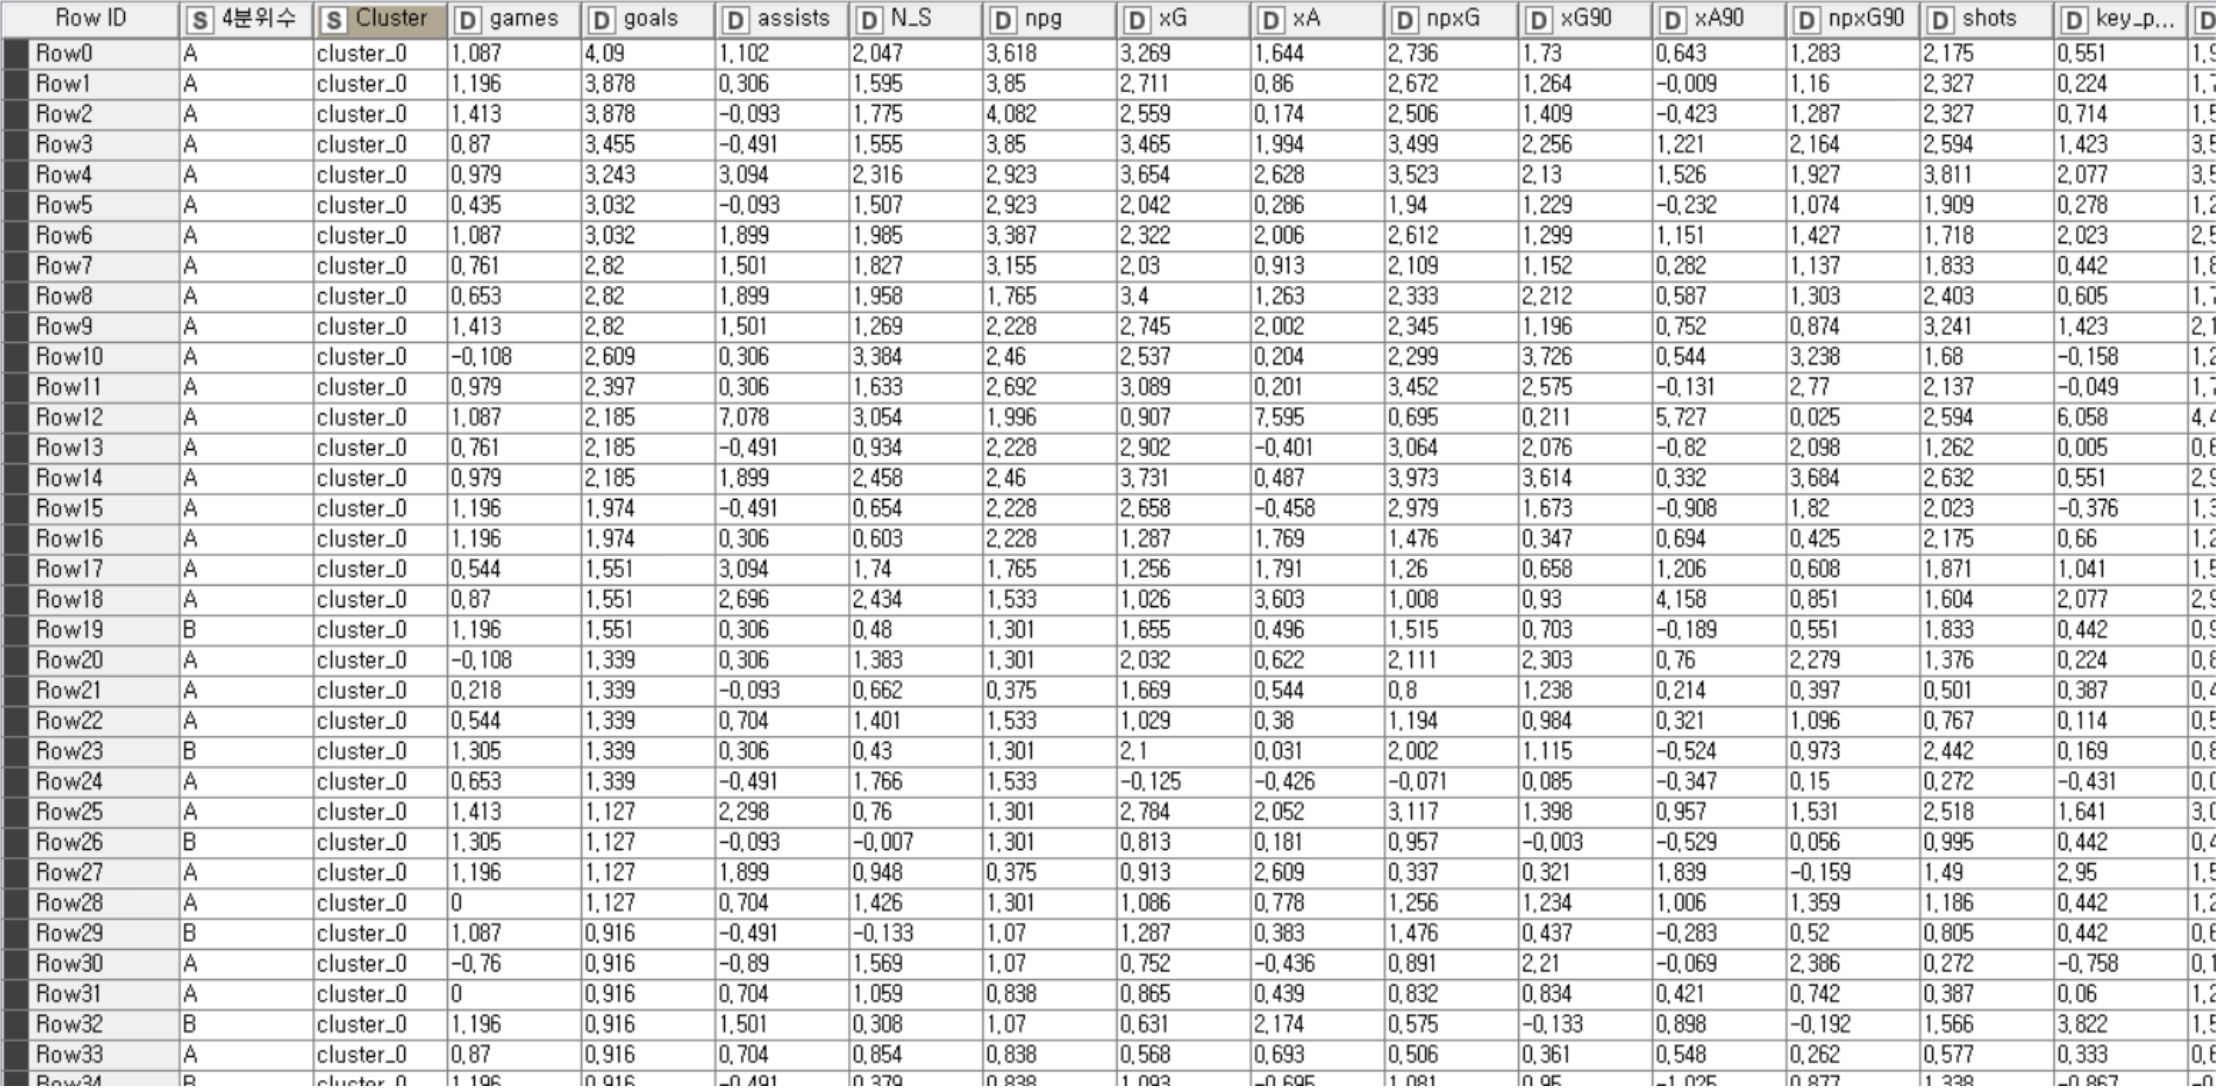
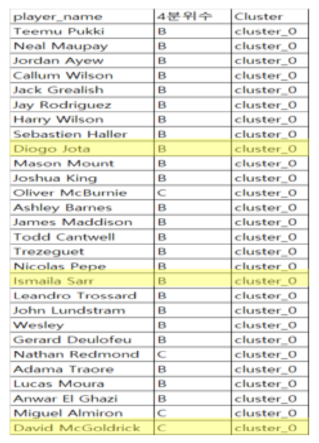
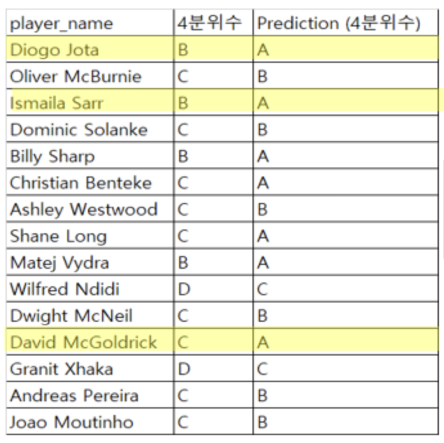
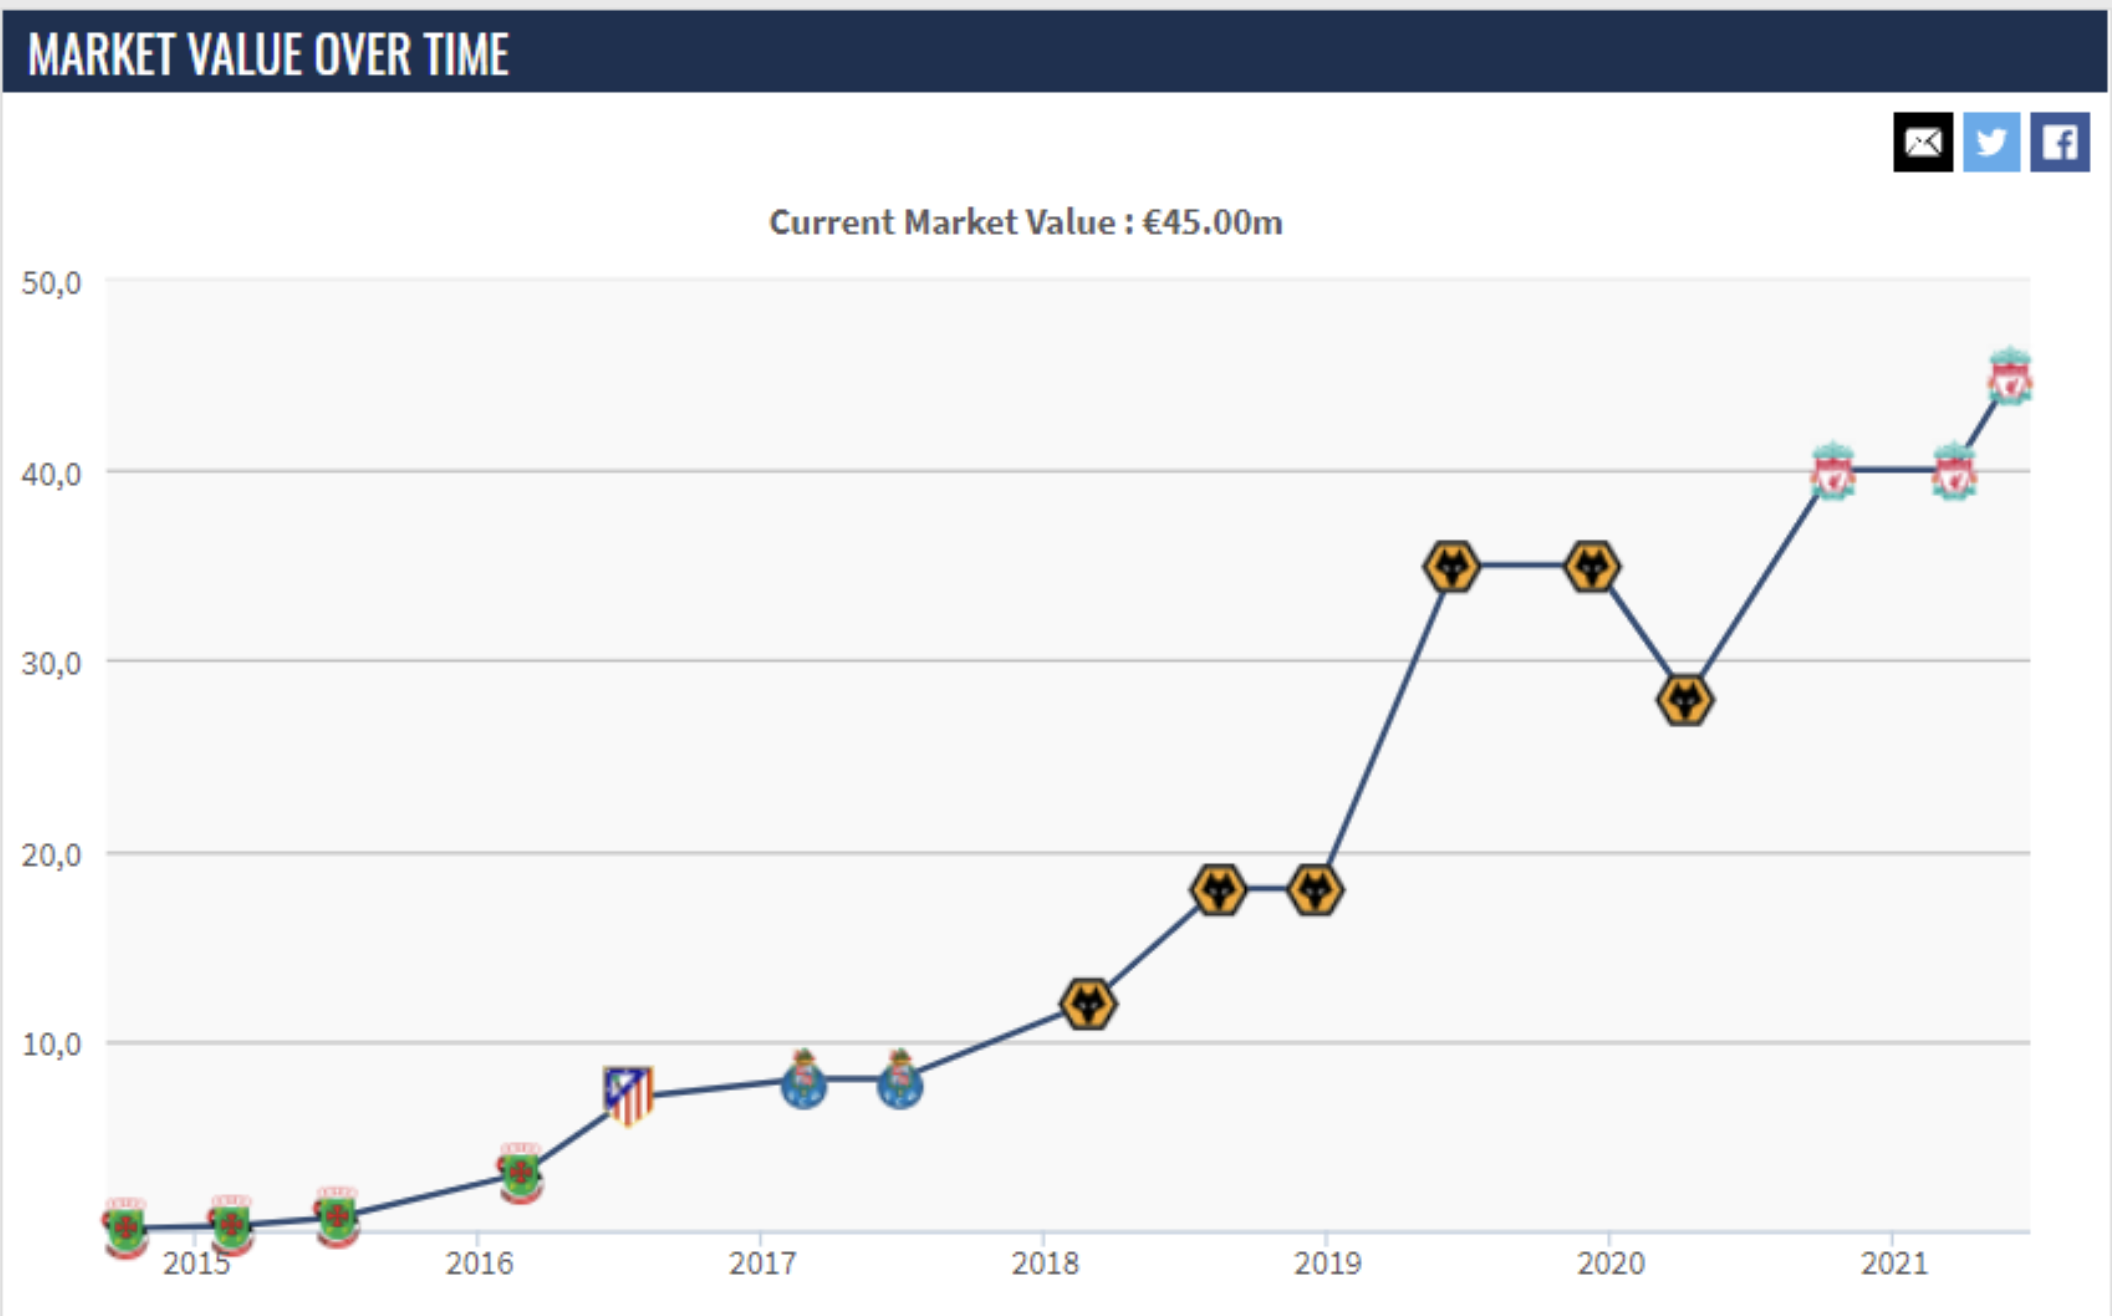
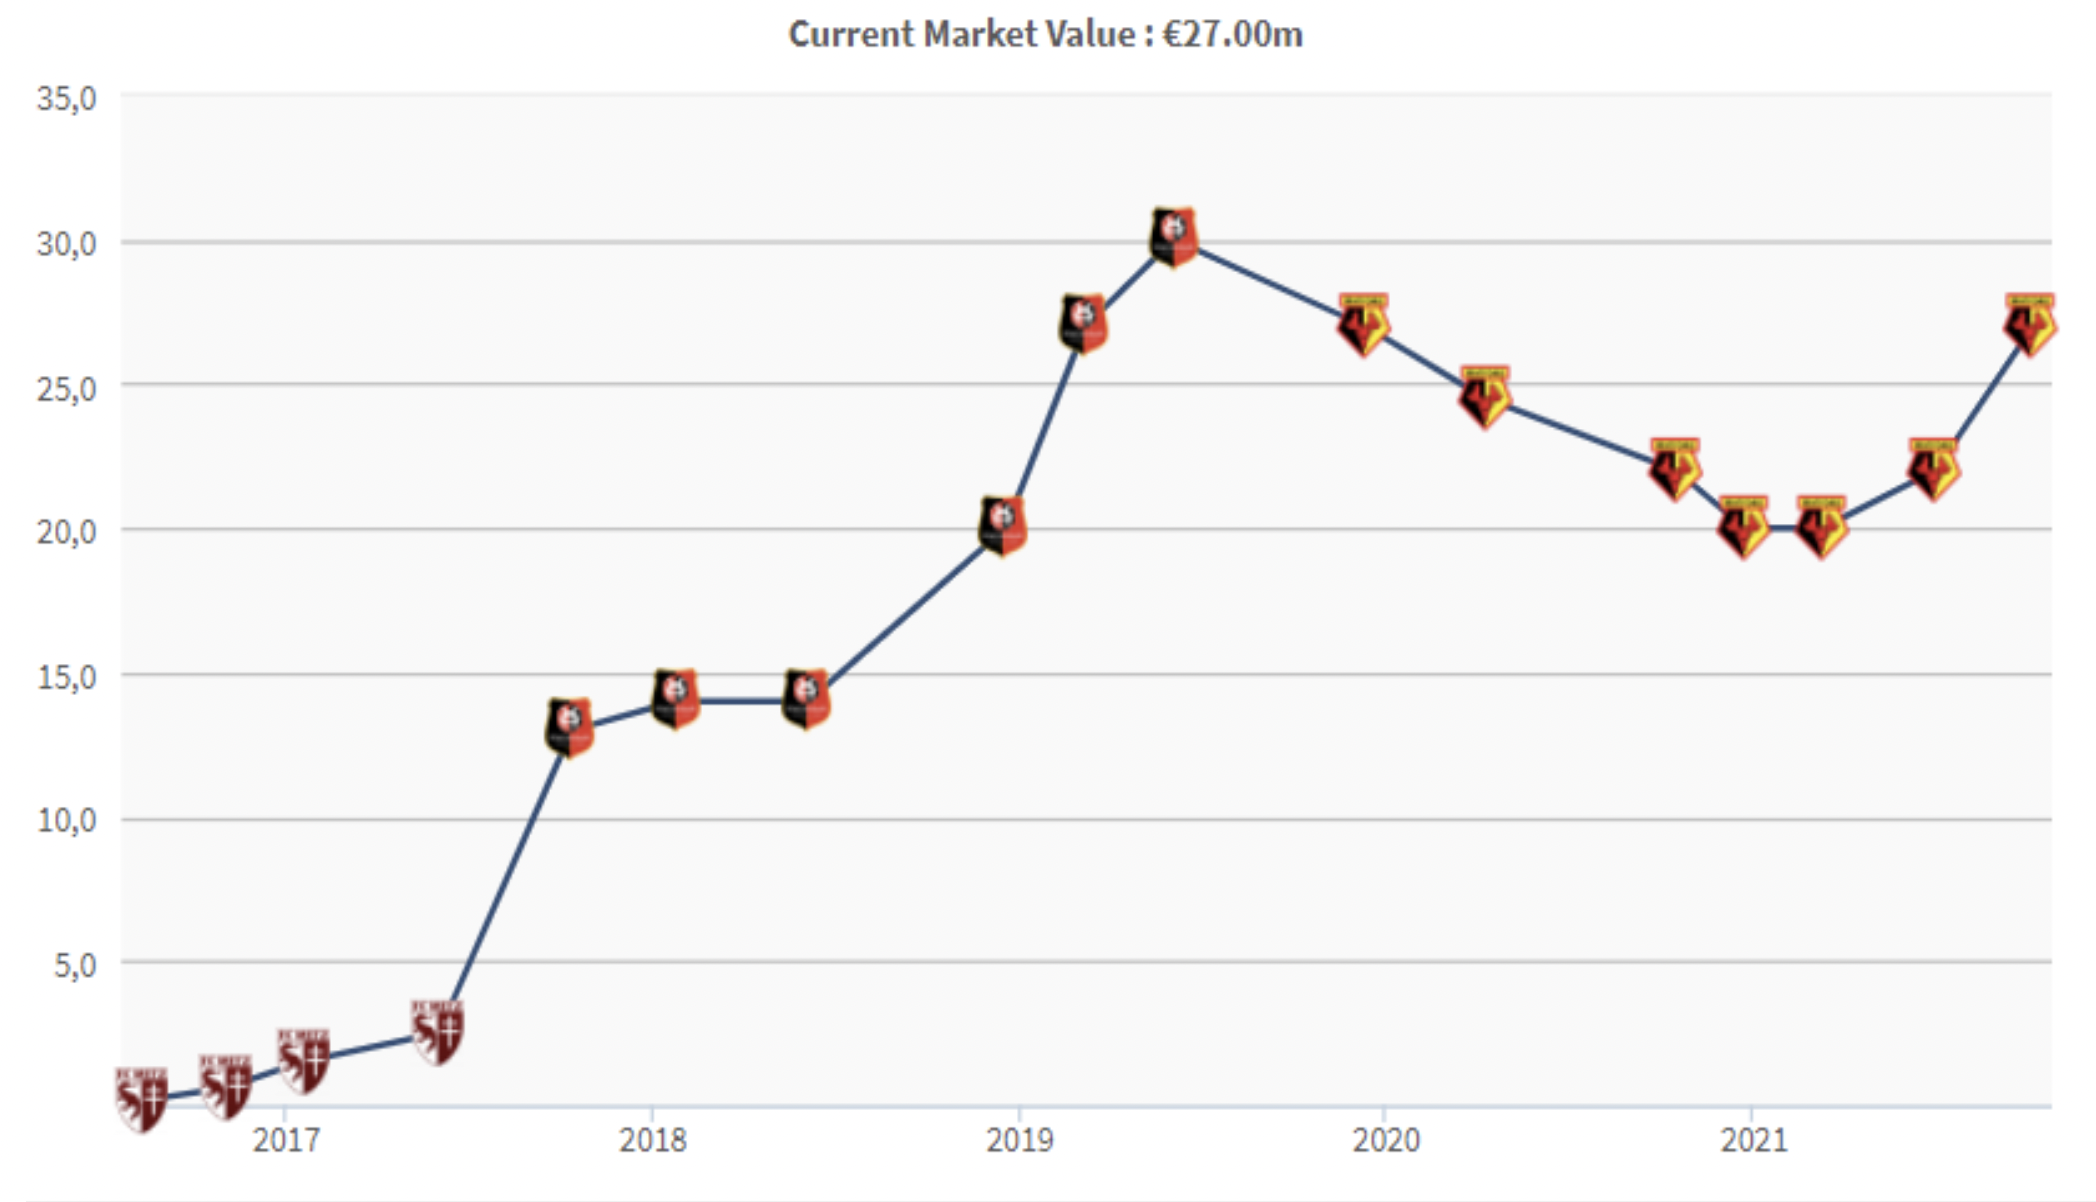
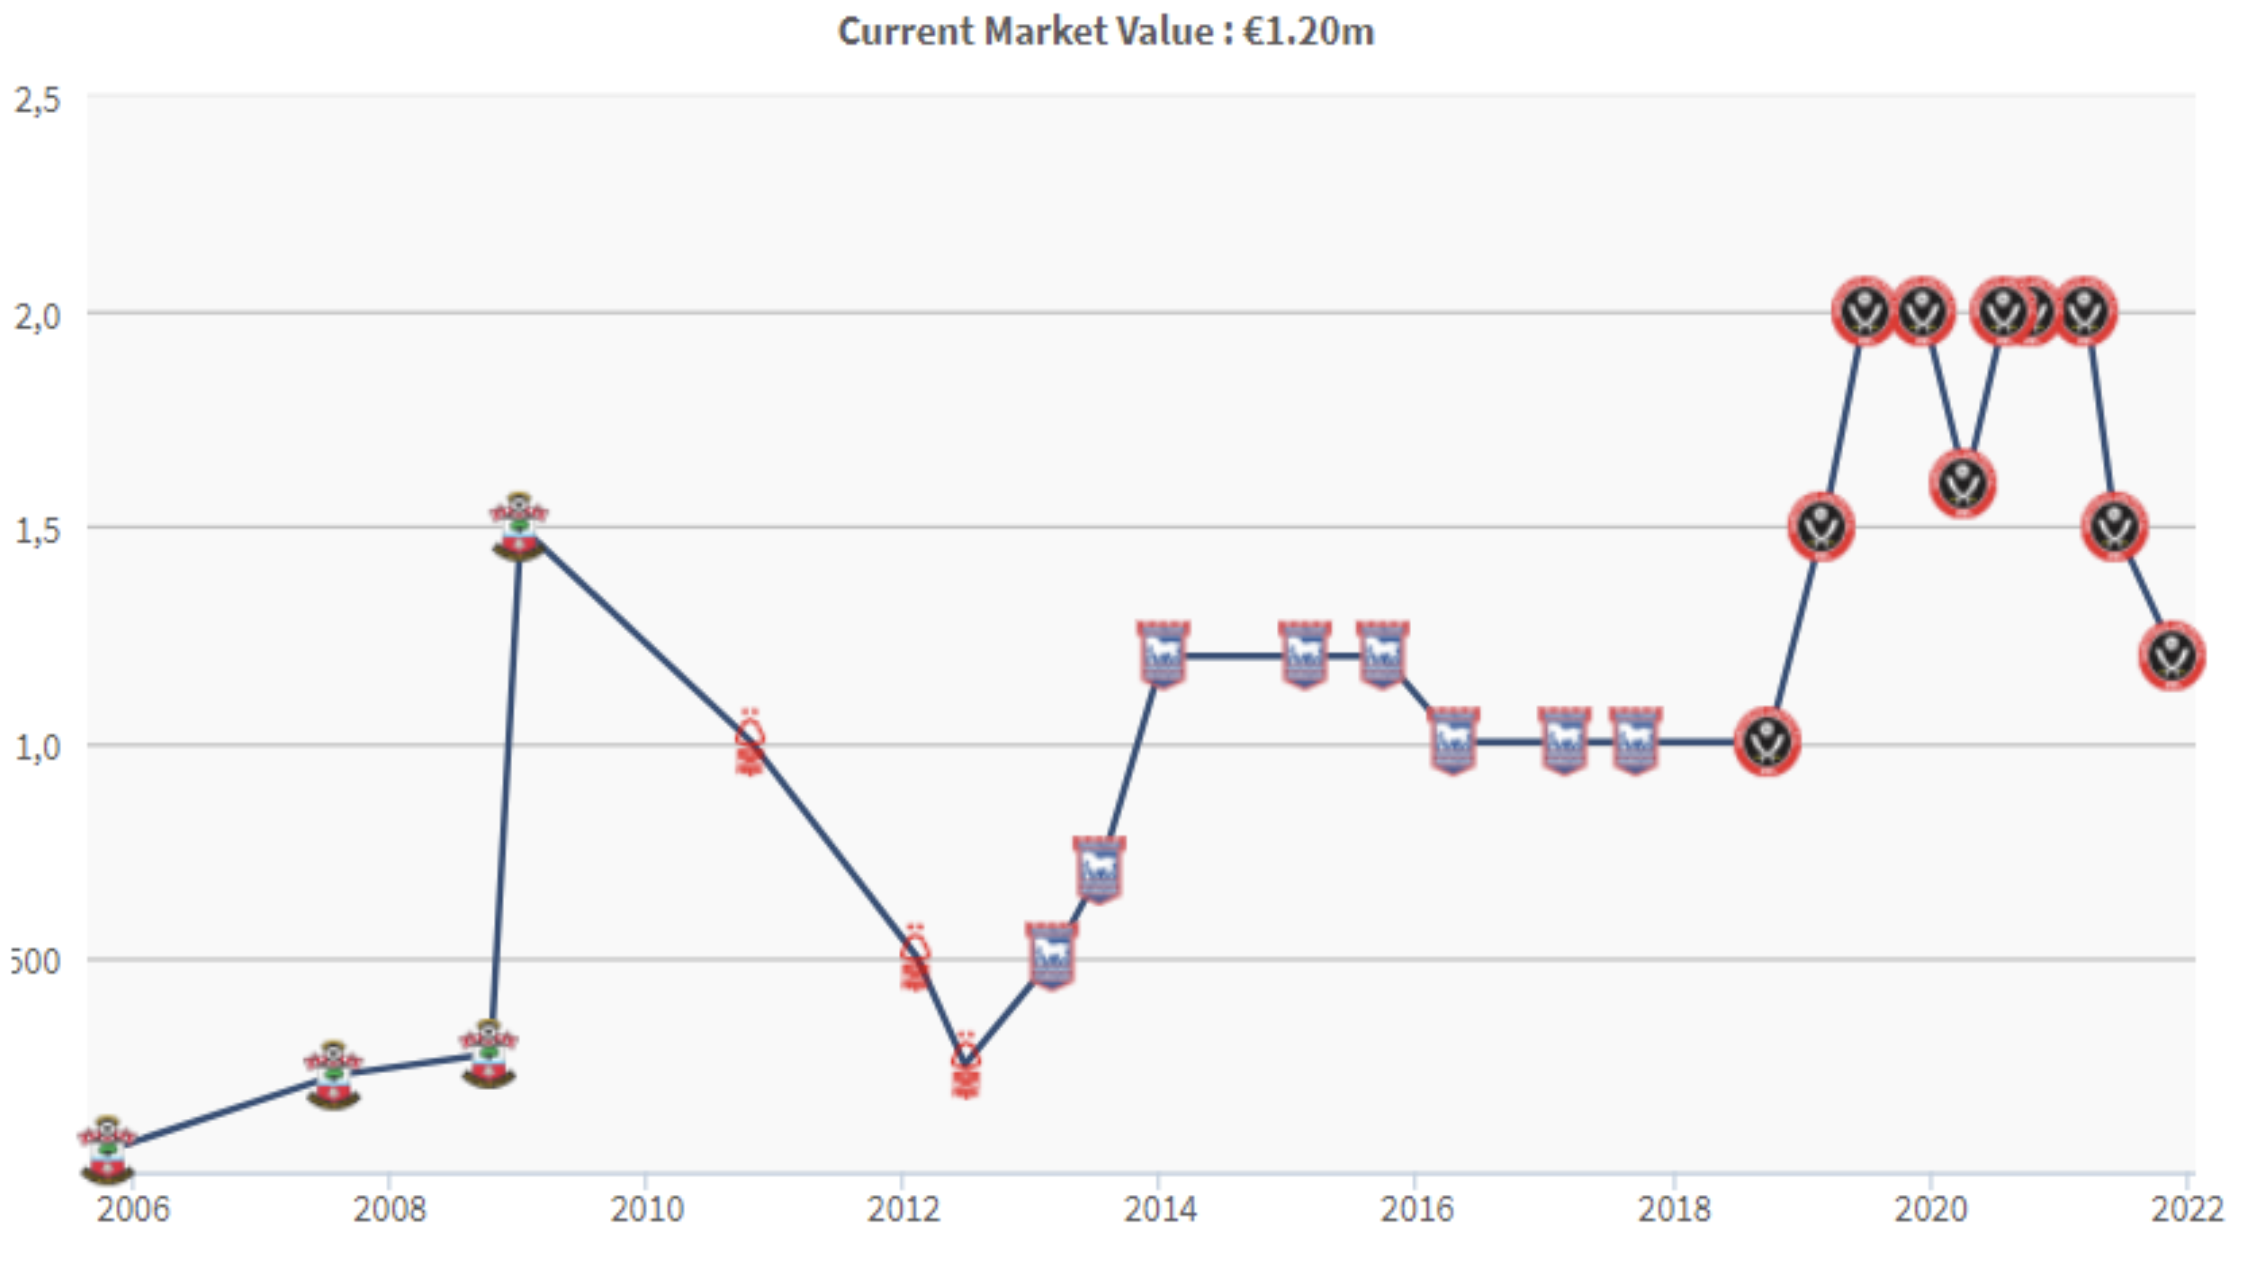
As a result of this data analysis, the most relevant variables of goals and assists were xG, npxG90, xG90, npxG, npg, and xA90. The three players from these analysis had a good performance in the 19-20 season, and other players who moved into upper groups through either Decision Tree or k-Means Clustering were also performing well within the league.

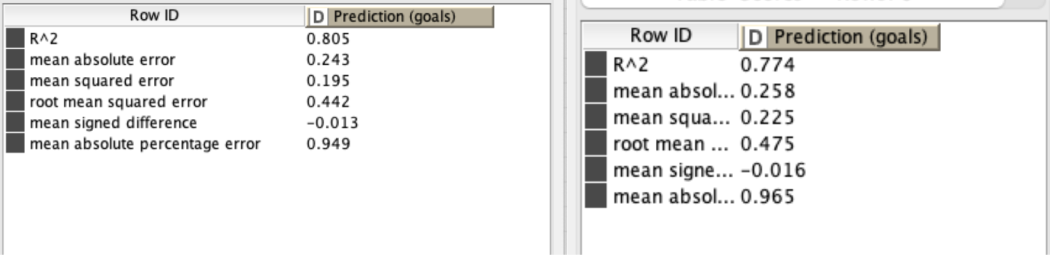
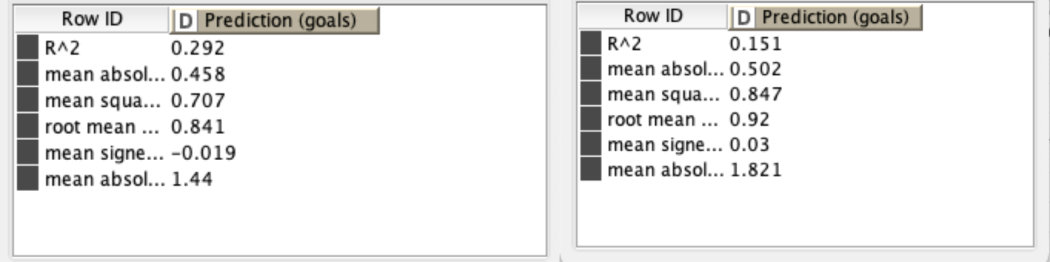
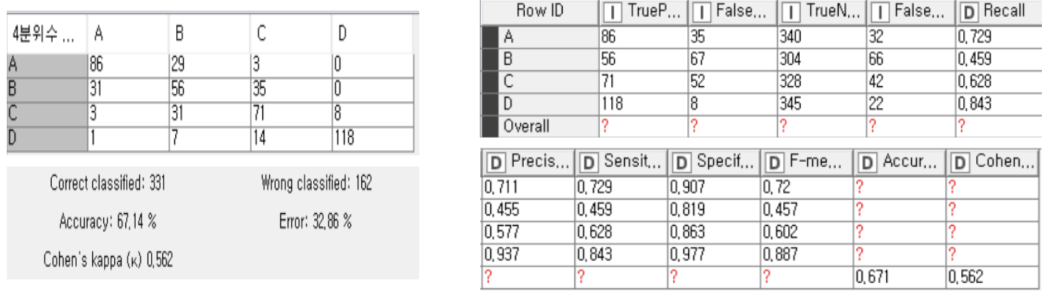
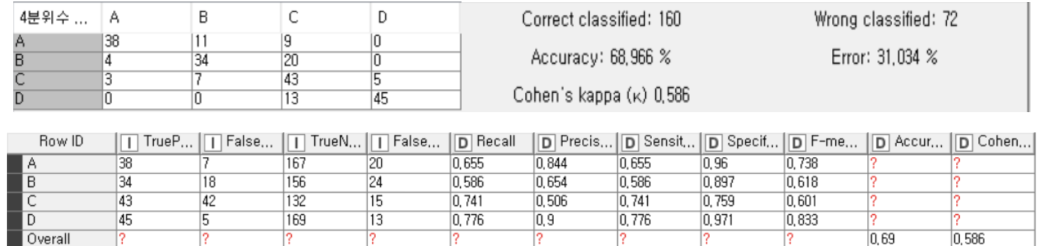
Although the analysis results were successful, since it was grouped into 4 quartiles, the accuracy was low in the Decision Tree and the k-means clustering results showed a linear appearance between most important variables. Also, we should have used the Random Forest prediction model to find related variables, not with both prediction and classification models. Moreover, since only soccer-related stats excluding the player’s age and injury history are used for those analyses, variables such as a decline in physical ability or an aging curve may exist, so it is clear that the data analysis result is not an perfect key to solve the problem.

However, this analysis was quite meaningful. It was the first data analysis project and in fact, although it is difficult to analyze data in soccer industry, we tried various analyses with a spirit of challenge. We were also able to measure players’ performance to some extent by comparing the actual performance of the players found by data analysis. We were confident that it was a sufficiently successful analysis because the process of solving actual business problems through data analysis itself was meaningful and showed sufficient possibilities.

In the next analysis, the decision tree analysis will be conducted by supplementing the above limitations and grouping the players into three quartiles, not four, and more effective data analysis and results will be derived by using Random Forest. Data such as age and injury history will also be added to strive for the better results.

More Projects

Kiddiez

Service Design

Mooday

Service Design

Spotify for the HOH

App Redesign

The Trevor Project

Web Responsive Design